


Weekly Good Reads: 5-1-1
Low Stocks Return Correlation, Inflation Upside Risk, AI and Productivity, 1 Percenter, Fear and Greed Index
Welcome to Weekly Good Reads 5-1-1 by Marianne O, a 25-year investment practitioner and the author of
on investing, economy, and wellness in an intuitive voice. All the Weeklies are here, and here is the index of charts and terms. You can easily subscribe to my newsletter by clicking below.Thank you so much for your support🙏.
Market and Data Comments

This week both equity and bond volatility went up with bond yield surging 10bp (10y) to 16bp (2y) in the US, and both stocks and bond prices fell.
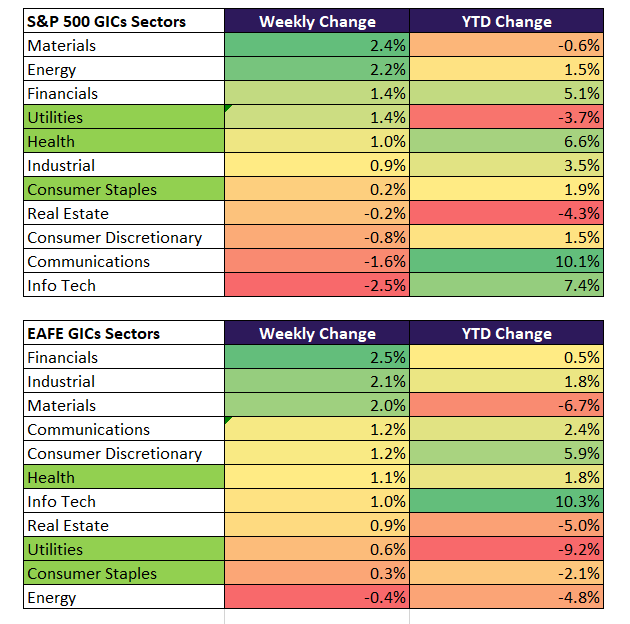
US January CPI (core CPI 0.39% m-o-m and 3.9% y-o-y) came higher than consensus, driven by a jump in core services inflation and shelter costs. January PPI data also turned higher (core PPI rose +0.6% m-o-m from +0.2% in December and 2.6% y-o-y). This implies the 6m seasonally adjusted annualized core PCE is at 2.5%, up from 1.9% in December. Stronger economic growth and higher inflation benefitted the materials sector (+2.4%, see heatmap below), which had the best sector performance this week.
The market has come full circle for Fed Funds rate pricing for June when dovish Fed speak started in November 2023 (see chart above). Now market thinks the Fed may cut under 4 times this year. The stronger-than-expected labour market and economic growth suggest a trade-off with the Fed’s target disinflation to the 2% level.
Research by the Atlanta Fed found that two-thirds of key underlying inflation measures are 0.5% above target on a 1m, 3m, and 6m annualized basis, which may point to a new burst of business demand.
Contrary to the US, both Japan and the UK entered into a technical recession in Q4 2023 (2 quarters of GDP contraction). But as Axios pointed out and what I mentioned here - the stock market is not the economy - the Japanese market surged given companies are turning more shareholder-friendly while the U.K. market has been allowing more dubious companies to list with the stock market doing nothing for 5 years.
In Europe, the officials expect a weaker growth of 0.8% in 2024 compared to the 1.2% forecast before, indicating the ECB may be the earliest to cut interest rates before the US and UK.
This coming week we will monitor the US FOMC Minutes on Wednesday and the February Euro Area Composite PMI on Thursday.

Economy and Investments (Links):
Worries About Commercial Real Estate Are Rising To The Top Floor (Finimize)
Enjoy the Low Volatility Because It’s Not Gonna Last: Macro Man (Bloomberg or click here)
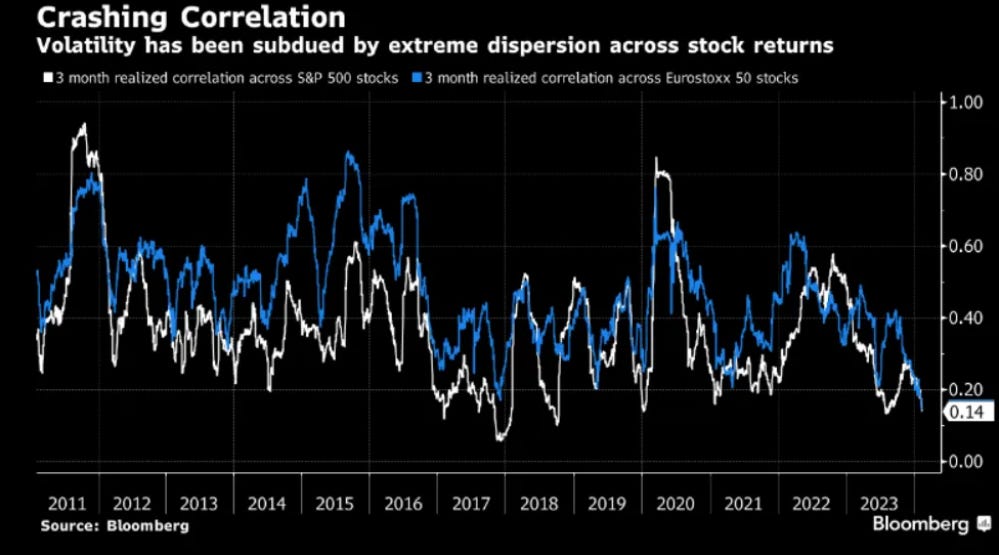
Because of the top-heavy performance of the S&P 500 thanks to the Magnificent 7 stocks, the correlation of returns of stocks within the index has plunged, i.e., stocks don’t move up and down together, which has suppressed the overall volatility of the index. This may not last and will have implications for future returns. Low correlation applies also to European stocks.
Since the end of January 2011, when the SPX three-month realized correlation [of returns of S&P 500 stocks) has been 0.15 or higher, the average three-month forward return has been 3.00%, with a median of 3.67%. The market has rallied nearly 75% of the time. On the other hand, when the realized correlation has been below 0.15, as it is now, the average three-month forward return has been -3.43% with a median of -2.77%. The market has been higher just 37% of the time ~ Bloomberg
Finance/Wealth (Link):
AI Is Already Making Us More Productive (Mauldin Economics)
…the productivity winners will be the companies that deeply integrate customized AI into their enterprise software and business systems, pairing it with automation whenever possible. Despite all the chatter, Nitin Mittal and Thomas H. Davenport note in their book All in on AI that only a handful of major companies have already done this.

Wellness/Idea (Link):
This Is How To Spend Your Money To Maximize Happiness (Barking up the Wrong Tree)
Spend Money On Fundamental Feelings: Forget the suburban gladiator arena known as “keeping up with the Joneses.” Instead of status, buy competence, relatedness, and autonomy.
One Chart You Should Not Miss: Top 1 Percenter
The graph below from Morgan Stanley shows the top 5 companies in market cap in the US and their share of Net Income, which shows a heavy rise in share % of net income (close to 9%). The market has subsequently rewarded these largest companies.
Higher interest rates and tight monetary policy have made it tough for interest-rate-sensitive sectors like housing and autos and small businesses. So, outside of the top 5 market cap companies, focusing on high-quality companies with good growth prospects, liquidity, and low leverage is key.

One Term To Know: Fear and Greed Index (CNN)
A popular index to measure the mood of the market is CNN’s Fear and Greed Index.
According to CNN, this index gauges stock market movements and whether stocks are fairly priced - excessive fear tends to drive down share prices while too much greed tends to make share prices surge.
The Fear & Greed Index compiles seven different stock market behaviour indicators. They are market momentum, stock price strength, stock price breadth, put and call options, junk bond demand, market volatility, and haven demand.
The index compares how much these individual indicators deviate from their averages to how much they normally diverge. The indicators are equally weighted with the score going from 0 (extreme fear) to 100 (extreme greed).

Please do not hesitate to get in touch if you have any questions! If you like this weekly, please share it with your friends or subscribe to my newsletter.
👋 This year, I will share my conversations with female fund managers, investors, founders, technologists and more! Subscribe to follow.
Thank you so much for reading and supporting my work 🙏.