


What is Going on with the Fed Dot Plot
What is it anyway and what do we look for?

The US Fed finished its last FOMC meeting of the year on December 13, leaving interest rates unchanged at 5.25-5.5%, and the Fed Dot Plot projections signalled 3 rate cuts next year.
Headlines next popped up include “Investors go 'all-in on infallible Fed', dumping cash and buying stocks” or “Powell Brings Tequila to Wall Street’s Rate-Cut Party”, and then more cautious ones inevitably surfaced: “The Markets Are Getting Ahead of the Fed”.
The S&P 500 index ended up 2.5% for the week, with the US 2-year and 10-year government bond yield dropping 28bp and 31bp respectively. The 10-year yield fell below 4% for the first time since the end of July.
What is causing the market euphoria (stocks and bonds), and what can the Fed Dot Plots tell us?
What is the Origin of the Fed Dot Plot?
Since 2007, the FOMC members, the monetary policymakers, released the Summary of Economic Projections (SEP), which are their projections of key economic variables (real GDP growth, the unemployment rate, and headline and core inflation) for the next 2 to 3 years.
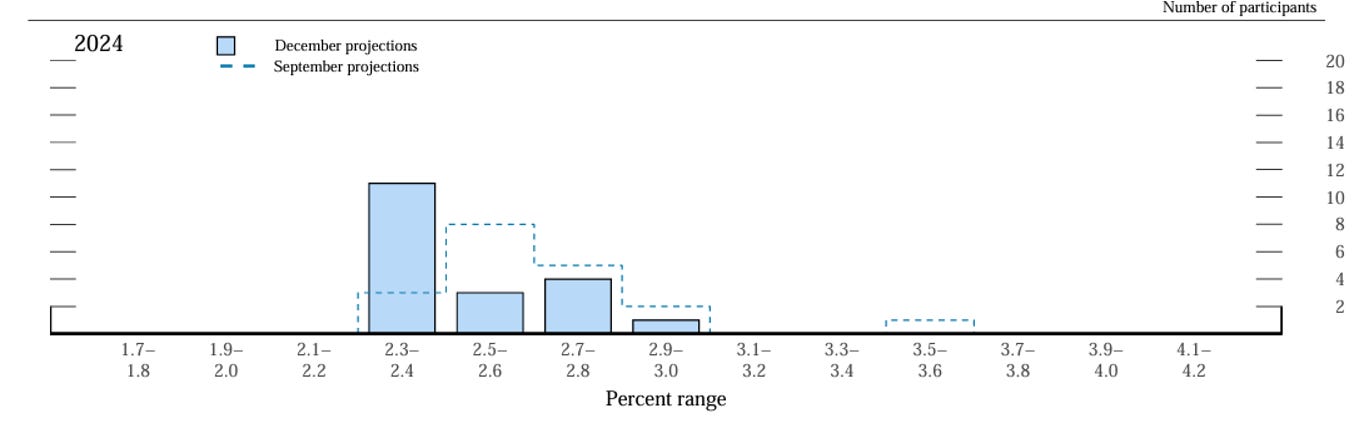
In 2009, the longer-run projections of the variables were added. These projections appeared as histograms to show the number of participants’ projections of each variable. For example, the below is from the December 13, 2023 SEP. It shows the distribution of the 19 participants’ projections of Core PCE Inflation (PCE inflation excluding the more volatile components of food and energy) for 2024. The 19 participants consist of 7 Fed Board of Governors and 12 Presidents of the regional banks, and only 12 out of 19 vote in the FOMC.
The long-run projections represent each participant’s forecast of how each economic variable will converge under appropriate monetary policy (satisfying the dual mandate of maximum employment and price stability.)
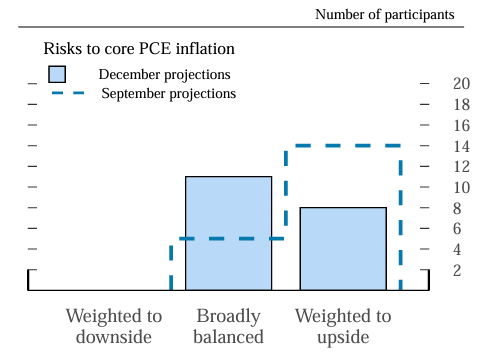
In 2011, quarterly press conferences by the Fed started, and the SEP would be released after each FOMC statement. Also included are the distribution of participant’s assessments of the balance of risks around their projections and the level of uncertainty relative to the past 20 years.
From the below, in the December projections, the participants viewed the risks to core PCE inflation compared to history to be relatively more balanced contrary to September where more participants thought there were upside risks to core PCE inflation than those who held balanced views.
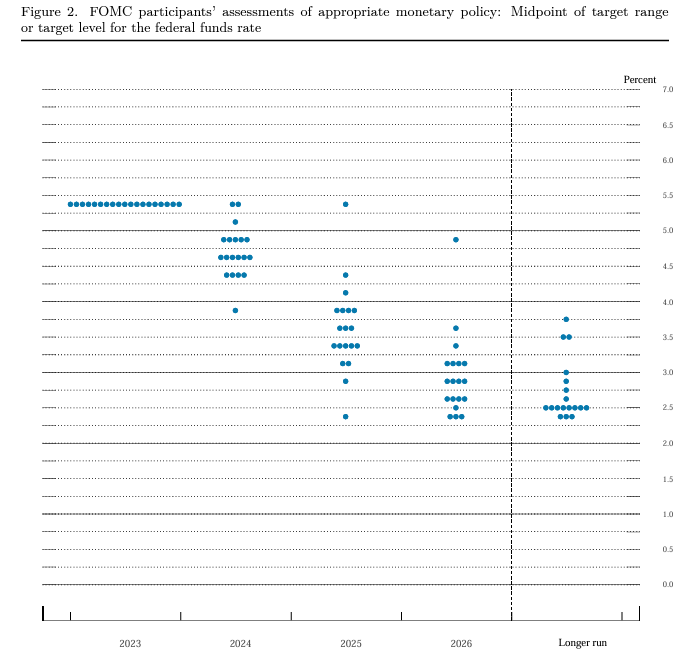
Starting in 2012, the SEP included the participants' assumptions about the appropriate level of the Fed Funds rate at year-ends and in the longer run. Individual assumptions are depicted in a picture informally called the “Dot Plot” because the dots show the frequency of a variable at a unique value.
More about how to interpret these dot plots and the caveats of interpretation later.
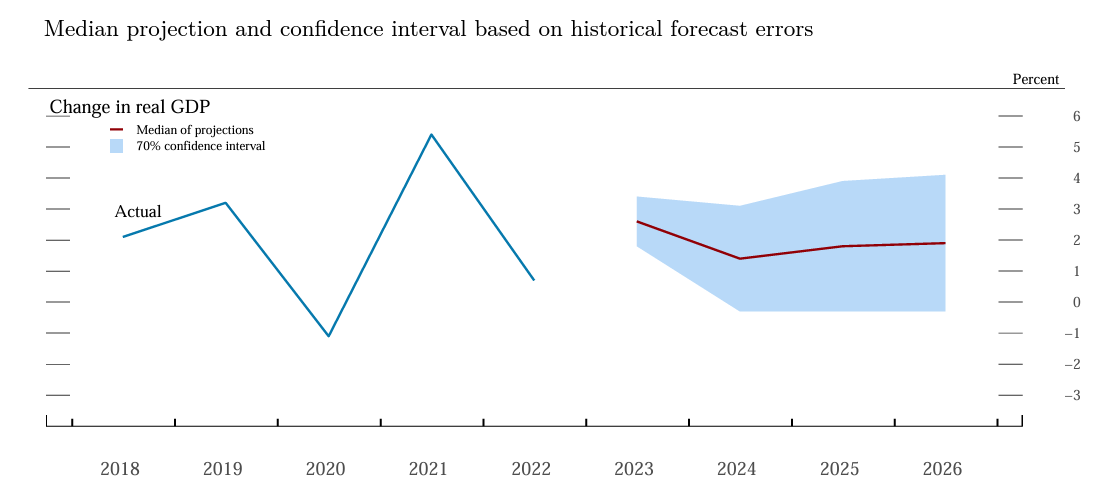
In 2015, median statistics of the economic variables were added to the SEP to complement the central tendencies and ranges. For example, the red line below represents the median projections of the Fed governors’ projections of real GDP growth for 2023 to 2026. The blue band represents they are 70% confident the median value lies within the historical (past 20 years) projection error ranges.
Interpreting the December 13, 2023 Dot Plots
Below are the December 13, 2023, SEP economic projections.
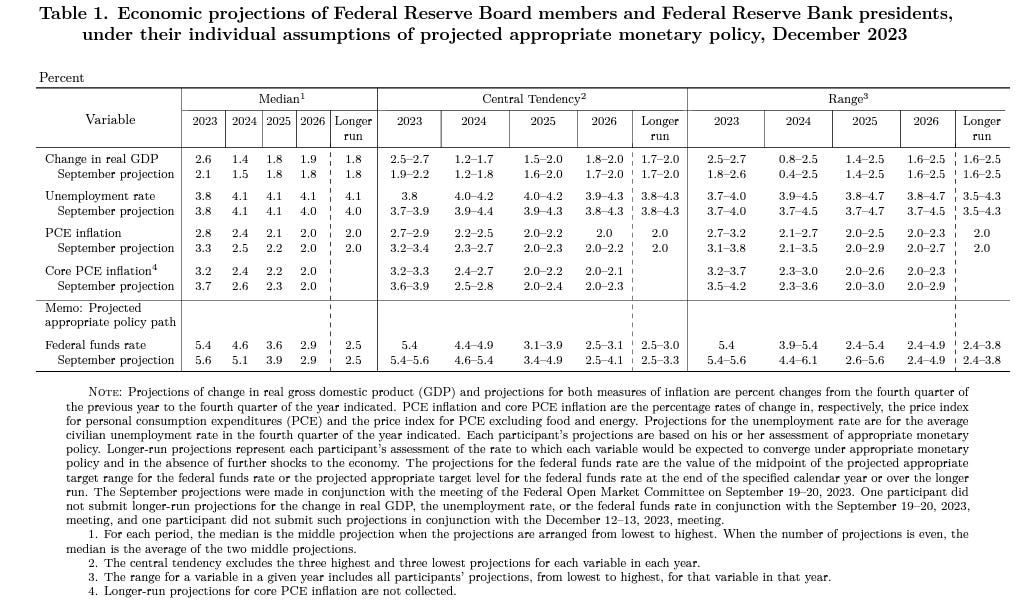
If you look towards the bottom of the table, you can see the year-end median projection of the Fed Funds Rate. In the December projection, the Fed Funds rate will likely decline from 5.4% this year-end to 4.6% by end-2024.
This is by no means what the Fed plans to do but the data represents the median of projections. A further caveat is that each person when projecting the dots may have a different set of economic models they use, and the dots have no faces.
If you compare the December with the September projected numbers, you can see not only does the December projection shows a lower Fed Funds rate (reflected in no more rate hike in December) but also the amount of rate cuts went from an estimated 50bp (in the September projection) to an estimated 75bp by the end of 2024 (or an estimated 3 cuts of interest rates).
The below chart shows the September and the December dot plots of various year-ends Fed Funds rates side by side.
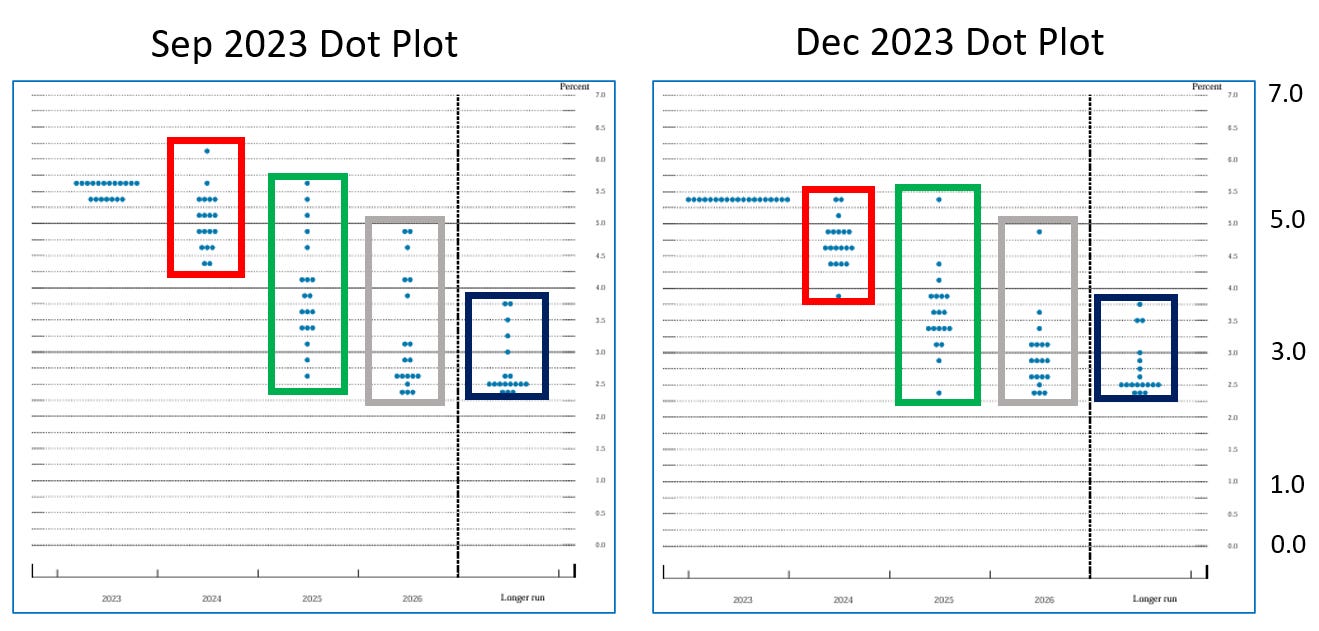
The first thing you notice is no one in December wanted to change interest rates.
Then you will notice the dots for 2024 (red box) generally shift lower with a majority of participants in the December Dot Plot anticipating the Fed Funds will end below 5% - this signals most participants expect cutting interest rates next year, also acknowledged by Fed Powell in the press conference a discussion of rate cut has begun. ‘Higher-for-longer’ is unlikely to hold. Note not even one participant anticipates a higher interest rate from now.
By the end of 2025 (green box), 16 out of the 19 policymakers expect Fed Funds to be below 4%, with the median at 3.6%. This will imply another 1% cut in interest rate in 2025.
By the end of 2026, a majority of participants expect interest rates to be below 3%, close to the neutral rate (nominal) of 2.5% where monetary policy is not too restrictive or too loose.
Over the longer run, the interest rate will fall back to around 2.5%.
Looking at Table 1 above of the economic projections, the pace of decline of inflation this year and the strength of the US economy surprised the participants as you can see the 2023 year-end inflation rate dropped 50bp while the real GDP change rose 50bp between the 2 projections.
For 2024, the economy will slow further to 1.4% while unemployment will tick up to 4.1% according to the median projections - still no recession.
There is more confidence the economy can do a “soft-landing”, i.e. lowering inflation towards the 2% target without inflicting a recession or pain in the labour market. Powell explained in the press conference that normalization of labour supply and supply chains has helped inflation decline as desired without inflicting recession. However, demand needs to come down to lower inflation further.
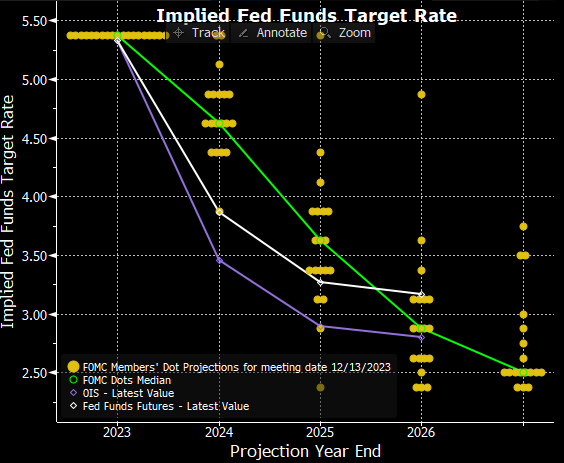
As shown in the table below, the Fed Funds Futures (the market) expect interest rates to drop below 4%, far below what the median dot plot for end-2024 is.
The biggest move after the FOMC meeting was in the 2-year government bond yield, which fell a whopping 30bp to 4.43% on Wednesday, as the Fed appears to give a nod to rate cutting next year.
For the investors amongst us, we can still heed what Chairman Powell said, “It’s far too early to declare victory and there are certainly risks (still facing the economy)” and stay diversified with various asset classes. Indeed market that rallies ahead of itself will loosen financial conditions, which can complicate the job of the Fed if inflation proves to be more stubborn.
✍ I write a Weekly and share links to my favourite economic, investment, finance, and wellness reads and discuss an important chart and a popular financial term. You can see more of my work here and feel free to subscribe below.
Thanks so much that’s a helpful list. I have also seen “criticism” of whether 2% is the right target or not but seems like the so far the Fed has kept to this as the right level that keeps the economy humming along
Very informative, thank you! I often think about how much the so called "inflationary psychology" plays a role. If folks think interest rates will increase, for instance, they will make large purchases before it does. This further exacerbates the inflation problem. Would be interesting to see how this data can be layered on (although consumer psychology can't be put into numbers that easily).