


Weekly Good Reads: 5-1-1
FOMC, economic slowdown, SBF lessons, Risk-free rate, Stress
Welcome to Weekly Good Reads 5-1-1 by Marianne O, an investment practitioner and author of
about investing, economy and wellness ideas. Every week I include 5 links to relevant economic and investment, finance and wellness/idea pursuit as well as 1 important chart and 1 term to know. All the Weeklies are here and here is the index of charts and terms. You can easily subscribe to my newsletter by clicking below.Thank you so much for reading and supporting my work 🙏.
Market and Data Comments
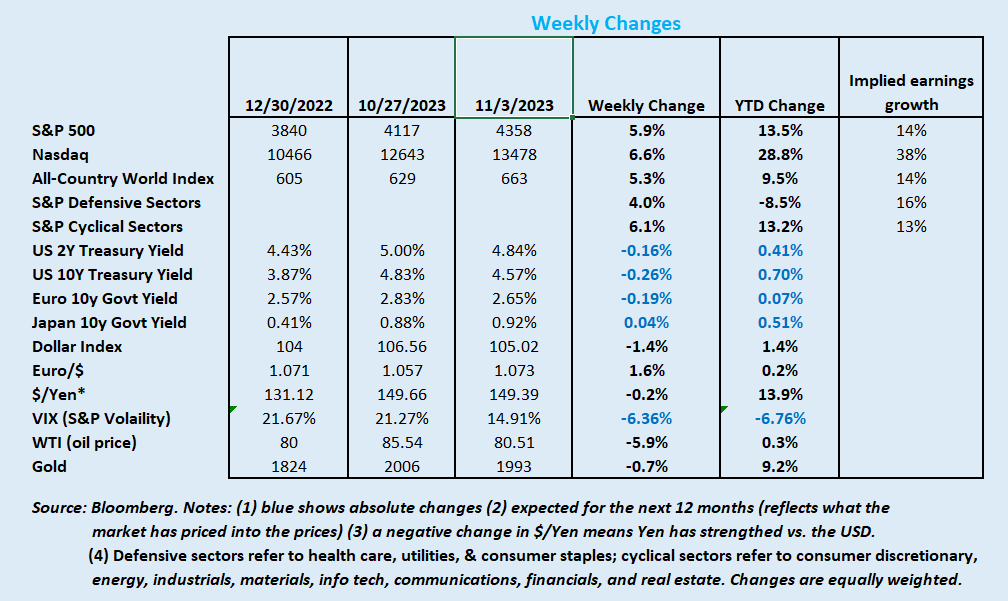
The week ended with equities rising close to 6% across the board in major stock markets, led by the cyclical sectors. US bond yields declined 26bp for the week while the Dollar Index fell 1.4%. Oil also declined 6% this week. What is behind all these big moves?
It could very well be the softer economic news around the world which led to bond rallying, propping up the equity markets.
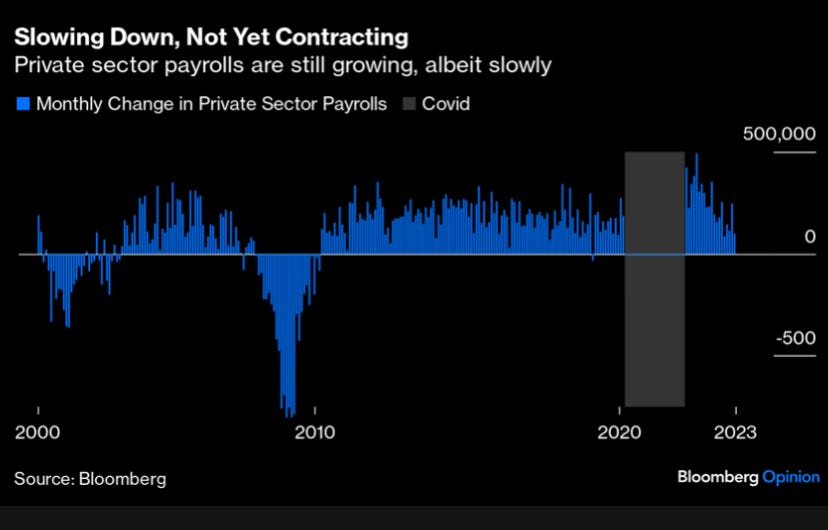
The week started with worse-than-expected (contractionary) China manufacturing PMIs, a negative Euro area Q3 GDP growth print (-0.1% qoq), Eurozone October inflation sinking to a two-year low, a downside surprise on US manufacturing ISM and weaker-than-expected US jobs data. Asia and global manufacturing activities also showed weakness. The widely expected Fed “pause” in interest rate hikes and US slowing (not contracting - see chart above) also helped.
There are however 2 things to note about the Federal Reserve keeping interest rates unchanged (5.25-5.5%) in the most recent FOMC meeting and what to expect about US Treasuries going forward.
First, as Barclays said, Chair Powell emphasised during the press conference that the market-led tightening in financial conditions needs to be "persistent" to have implications for monetary policy, which may not be the case after the recent price action. Indeed, the 10-year yield is now only about 15bp above its level at the time of the September FOMC meeting. The Fed may still have work to do early next year.
Second, Bloomberg Economics provide a solid reason for the recent turmoil in US Treasuries: the cumulative effects of persistently heavy government borrowing, increased spending on climate change initiatives, and stronger-than-expected economic growth could bring about a 10-year bond yield of 6% in the long run. Not just bond investors will feel the pain but because the 10-year US Treasury is a risk-free/reference rate on which other assets are priced. A continuous rising US Treasury yield will mean weaker prices for many other markets. On the contrary, if soft landing becomes more certain, bonds rally, supporting equity prices, which we have seen in the past week.
This coming week we will monitor the various US Fed governors’ speeches throughout the week, Germany’s September industrial production data and China’s October exports on Tuesday as well as China’s October CPI and PPI on Thursday.
Economy and Investments (Links):
Powell Hints Fed Is Done With Hikes in Pivot Cheered by Markets (Bloomberg)
Where is This Rally Going (The Big Picture)
Lessons From the Sam Bankman-Fried Trial (Bloomberg)
Scaramucci said one big lesson is due diligence. "We've got to do a way better job of following the money," he said, and he's doesn't mean just for SkyBridge. "You need a lot of people to turn keys before money moves." The fraud at FTX was found to be carried out by just a handful of young entrepreneurs, some who lacked financial expertise entirely but were given money anyway.~Bloomberg
Finance/Wealth (Link):
Advice for House-Hunters Frustrated by the Frozen Market (Euro.ES Euro)
Wellness/Idea (Link):
Pandemic-Related Stress Levels Persist (Wise & Well Substack)

One Chart You Should Not Miss: Countries by Household Debt

From the above chart sourced from the IMF, household debt as a percentage of GDP varies widely across regions and within the region. In general developing countries have lower household debt-GDP ratio compared to more advanced countries, especially welfare states such as Norway and Canada and a “modified” welfare state such as Australia, which can encourage borrowing.
One Term To Know: Risk-Free Rate
A risk-free rate technically means an investment that is safe and has zero chance of loss. A risk-free rate is hypothetical but investments such as US Treasuries (short-term bills or longer-term government bonds) come the closest to risk-free assets because the full faith of the US government backs them. While the US government has never defaulted, the repetitive fear of government shut-down has put a dent in investor’s faith in the functioning of the government.
I would like to consider a risk-free rate as a relative risk concept. All assets are priced relative to something. Often you can look at any market and build out a “Risk Curve” - moving from the safest asset to the riskiest asset (i.e. from government bills, government bonds, high grade, high yield, to equities). Normally, the risk curve is upward sloping, with the safest asset having the lowest return while the riskiest asset (equities) has the highest expected return.
Below is the US Risk Curve as of October 31. Did you notice a bump - a high-yield corporate bond has a relatively higher expected return than US equities (S&P) as the high-yield bond is senior to equity in capital market structure. A risk curve is a useful concept for thinking about asset allocation within and across any market.

Risk-free rate is the base of modern finance and is a key input to many models such as the Capital Asset Pricing Model and Modern Portfolio Theory.
Please do not hesitate to get in touch if you have any questions! If you like this weekly, please share it with your friends or subscribe to my newsletter.