


Weekly Good Reads: 5-1-1
Stock Rally Pause, 2025 Outlook, Warren Buffett, Exuberance, Neutral Rate Revisited
Welcome to a new issue of Weekly Good Reads 5-1-1 by Marianne, a 25-year investment practitioner writing about investing, economy, wellness, and something new I learned in AI/productivity.
In this Weekly, I share insightful/essential readings, charts, and one term, incorporating some of my market observations and weekly change tables. I look beyond data and share something enlightening about life, health, technology, and the world around us 🌍!
Sharing the quote of the week:
The best thing a human being can do is to help another human being know more.
~ Charlie Munger
Weeklies archive | Investing | Ideas | Index of charts and terms
Conversations with Female Investors and more (to inspire more females into finance and investment careers 🙌.)
Here’s my latest post in case you have missed it:

👉 One more: here’s an invitation to try our digital investment software for creating customized portfolios tailored just for your goals and risk profile (for free):
Market and Data Comments

US October core CPI (0.3% m/m and 3.3% y/y) and PPI data (0.2% m/m and 2.4% y/y) are pointing towards a slightly stronger core PCE deflator in October at 2.8% y/y, more than the Fed’s forecast and desire.
With robust October retail sales at 0.4% m/m (a revised 0.8% m/m in September), Powell signalled again this week the Fed is in no hurry to reduce rates given the strong economy (see higher US Economic Surprise Index below is pushing US Treasury yield higher.)

Market optimism about Trump’s deregulation, pro-business/domestically-oriented policies, and tax cuts have fuelled the stock rally post-election and growth expectations. However, the higher fiscal debt burden and stronger growth continue to push and keep interest rates higher as inflation will be higher, likely reducing the pace of the Fed rate cut.
Valuation is already stretched—Bloomberg modelled the S&P 500 earnings yield and the US 10-Year Treasury bond yield adjusted for inflation and found they were now higher than 88% of the time in data going back to 1962 (see Econ/Invest #1). The latest Bank of America survey also showed US equity exposure at an 11-year high (lots of optimism).
No wonder the market rally took a breather, with the S&P 500, Nasdaq, and the Russell 2000 falling 2, 3, and 4% respectively this past week and the US 10-Year Bond yield rising 14bp to 4.44%. The stronger-for-longer dollar index under Trump’s policies led commodities to falter with gold, oil, and copper falling between 4.5 to 5.5%.
The macro economy faces a significant shift, especially regarding trade policies, with the US Congress under Republicans.
The chart below from Deutsche Bank shows a very long-time chart of the US debt-to-GDP ratio. While the US debt was supposed to be eliminated by 2013, the level by 2050 could rise beyond 150% of GDP. Total global debt-to-GDP is almost 100% higher than at the beginning of 2000.

Nevertheless, with a robust economy as the starting point (albeit stretched valuation) and likely less extreme implementation of Trump campaign policies, Goldman Sachs summarized below 10 core investment themes for 2025.
The conclusion suggests maintaining US equities exposure for some upside (as the US is still expected to outperform Europe and Emerging Markets, and China's outlook becomes more uncertain due to Trump’s tariffs but remember China’s trade as a percentage of GDP is only about 37%, not a significant driver of GDP growth), but be as diversified in the investment portfolio regionally as possible and use options to limit losses.

Internationally, GDP growth in 2024 and 2025 is expected to be 0.7% and 1.2% in the Euro Area (consensus), Japan, 0% and 1.2%, and China, 4.8%, and 4.5% respectively. Looking at the graph below (on the left, China’s economy has stabilized as the government has pushed out stimulus in terms of subsidizing the purchase of equipment, autos, policy easing, plans to relieve local government debt, monetary policy easing, etc. However, property investment dropped 10.3% in the first 10 months and prospect remains weak.

In the coming week, we will monitor the US October existing home sales on Thursday, the Euro Area October inflation on Tuesday, Germany’s Q3 GDP and the Euro Area November Composite PMI on Friday, the UK October CPI on Wednesday, the UK November Composite PMI on Friday, Japan’s October CPI on Thursday and China’s 1y MLF rate next week. Nvidia is due to report its Q3 earnings on Tuesday (Nov 19).


Economy and Investments (Links):
The Great Post-Election Rally Hits a Wall as Powell Weighs In (Bloomberg)
Warren Buffett Is Raising Cash—and Missing Out on the Booming Market (Barron’s or via Archive)
+ Related: Warren Buffett’s Berkshire Hathaway Bought Itself a Slice of Domino’s (Finimize) - [N.B. the fact that he is a net seller of $127 billion of stocks this year probably means he is not seeing stock opportunities currently but with a $311bn of cash buffer, he has plenty of firepowers to pounce when the market cheapens.]
The Shift to Global Reshoring is Already Happening (Axios Macro)
State of play: The latest evidence is from a survey, conducted by management consultancy Bain, of CEOs and COOs of mostly $1 billion-plus multinational companies.
It found that 81% plan to bring their supply chains closer to home, up from 63% just two years ago.
Those efforts are underway, but far from finished. Only 2% of respondents had fully completed their reshoring or near-shoring plans.
The share of companies looking to move activity out of China is up to 69%, from 55% two years ago.
Finance/Wealth (Link):
What’s About to Hit the World Economy? (The Economist or via Archive)
We have taken a close look at what all of this means for the world economy. The conclusion markets seem to be drawing is that things will work out just fine. And indeed Mr Trump’s commitment to deregulation may be good for growth. But the same can’t be said of his plan to deport millions of irregular migrants and impose sweeping tariffs, especially on China. Soon the hyperbole of campaign pledges will come into contact with the messy reality of governing. Then we will begin to understand the real impact of Trumponomics (from the Economist Weekly Highlights).
Wellness/Idea (Link):
What Is an "Ingredient Household" and How Do You Know if You Have One? (Parents)
The term quickly rose to popularity and with it came an official entry in Urban Dictionary, which defines the term as “a home that has no ready-to-eat foods or snacks, only the ingredients to make food…
There are many nutritious, ingredient-centered snacks that are convenient, will satiate your kids’ hunger, and meet your nutritional goals all at once. Greek yogurt, nuts and seeds, whole grain crackers, cheese, pickles, and eggs are some popular options.
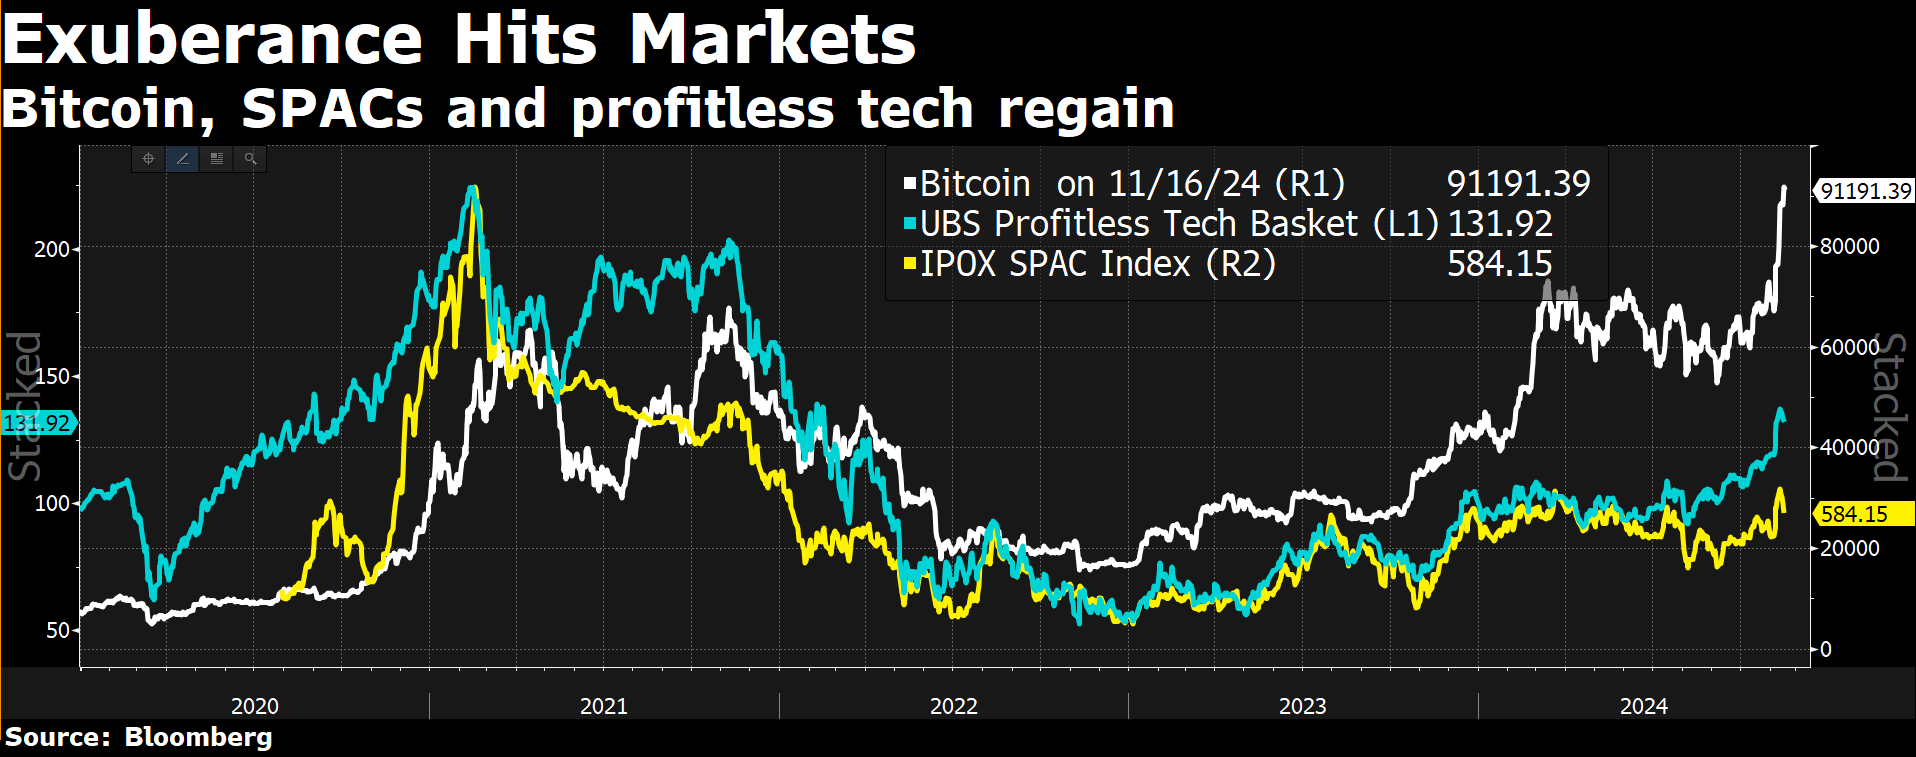
One Chart You Should Not Miss: Exuberance in Markets
The three instruments below all have high volatility and are considered speculative positions as valuations are hard to estimate (e.g. Bitcoin and Profitless Tech) and due diligence on the fundamentals is not as strong as those IPO’d (e.g. SPAC).
Quick surges in these positions reflect market euphoria and optimism. Bitcoin rally is helped by Trump’s likely favourable policy towards digital assets.
Time to be watchful!
One Term to Know: The Neutral Rate of Interest Revisited
The neutral rate of interest (also called the long-run equilibrium interest rate, the natural rate of interest and, to insiders, r-star or r*) is the short-term interest rate that would prevail when the economy is at full employment and stable inflation: the rate at which monetary policy is neither contractionary nor expansionary. It is a function of the economy’s underlying characteristics and is not set by the Federal Reserve. It’s usually discussed in real terms, that is, with inflation subtracted out. The neutral rate cannot be observed directly; it can only be estimated.
~ Brookings Institution
The neutral rate matters because it serves as a guidepost for the Fed’s monetary policy - if the Fed wants to cool the economy, it may set the policy rate above the neutral rate and vice versa. Fed Powell warns of an over-reliance on the neutral rate, which we know only after the fact not in real-time. He prefers a risk management approach of “balancing the risk of tightening monetary policy too much against the risk of tightening too little.”
What is the level?
In the latest Summary of Economic Projections (SEP), the Fed estimated the long-run nominal neutral rate to be 2.9% (assuming a target of 2% inflation), which has increased from 2.5% in late 2019.
The market’s own estimate of the neutral rate is reflected in the 5-year Yield 10 Years Forward, which at about 4%, is higher than the Fed’s long-run neutral rate.

Various econometric models found that the neutral rate ranges from 2.8% to 4.6%, averaging 3.8% as of Q3 2024.

The popular Hoston-Laubach-Williams Model (Real-Teim Pre-Pandemic Estimate of Neutral Rate) has risen to about 0.7% (real) using the latest data (previous estimates were probably too low).

What to Expect?
The Fed officials likely believe the neutral rate in this cycle to be higher than the long-run nominal neutral rate due to fiscal and other policies boosting aggregate demand to offset the impact of the higher rates. Coupled with the strong risk-taking sentiment in the market, the Fed may end up stopping the interest rate at around 3.25-3.5%, 100bp above the peak reached in the last cycle (Goldman).
[🌻] Things I Learn About AI/Productivity:
OpenAI Nears Launch of AI Agent Tool to Automate Tasks for Users (Bloomberg)
The planned release [codenamd Operator] in January is part of a broader industry push toward agents, or AI software that can complete multi-step tasks for users with minimal supervision.
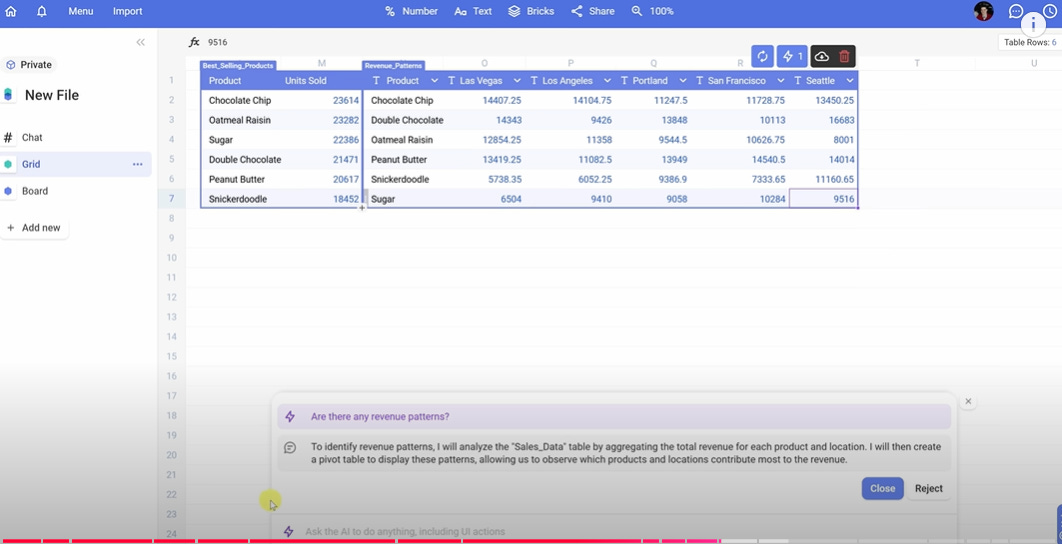
Bricks: The AI-powered Spreadsheet
Thanks to @KevinStratvert on YouTube (one of my favourite instructors on practical application of technology), I came to test the capability of the AI spreadsheet - using natural language prompts on my own data to generate analyses and dashboards.
I am pleasantly surprised by how fast the response time is and how intuitive it is to use Bricks. No more Excel formulae to remember or to Google Search! Bricks can help generate data tables and dashboards, do vlookup, regression equations, pie charts, and pivot tables efficiently. There are a lot more use cases. However, it is not yet good at compiling more complicated graphs such as heatmaps and displaying ranked items grouped by categories on charts. Information, however, can be shared online with teams and the public easily.


Have a productive week!
Please do not hesitate to get in touch if you have any questions!
Please also check out my Conversations with female fund managers, wealth advisors, and more.
If you like this Weekly, please share it with your friends or subscribe to my newsletter🤝.