


Weekly Good Reads: 5-1-1
Fed, Japan, Google Search (Sorry State), Healthy Chinese eating, CAPE
Welcome to another issue of 5-1-1! I am Marianne O, an investment professional and author of The Learner’s Mind on investing, economy, and wellness ideas. For this Weekly, I include 5 links to relevant economic and investment news, finance, and wellness/idea pursuit based on what I read. I also include 1 important chart and 1 investment term to know. You can easily subscribe to my newsletter by clicking below.
Market and Data Comments
The FED and the European central banks hiked interest rates by 25bp this week as expected.
Stealing the show, the Bank of Japan surprised the market by tweaking its Yield Curve Control (the central bank buying various amounts of government bonds to target interest rates at a certain level) essentially by moving the cap of the 10-year Japanese Government Bond yield to 1% (from 0.5%) despite leaving short-term interest rate unchanged and keeping the target long-term bond yield at 0% (becoming meaningless).
Given that Japanese investors own the biggest amount of US government debt and a sizeable amount of European bonds, the market reacts. This move signals there is no more anchor in global yield and Yen jumps against the USD by 0.4% during the week. The 10-year Japanese Bond Yield jumped 12bp this week.
All three major economies exhibit different growth dynamics, hence the US may see another rate hike due to still high service inflation and robust activities, while Europe may stop hiking given weak growth, and Japan de facto has ended its Yield Curve Control due to above-potential growth and persistent inflation (see article below).
In FED chair Powell's press conference, he attributed the disinflation to both Pandemic normalization and monetary policy, but he is focusing on using monetary policy to clamp down on non-housing service inflation, especially in the labour market going forward. Monetary policy is not restrictive for long enough to reach their desired 2% long-term target. His job does not seem to be done yet.
However, this graph on the dramatic rise in Federal interest expense by Michael Lebowitz in “Higher for Longer is Over” may prompt the US to start cutting sooner than we think.
also discussed rising federal interest payments in his recent piece.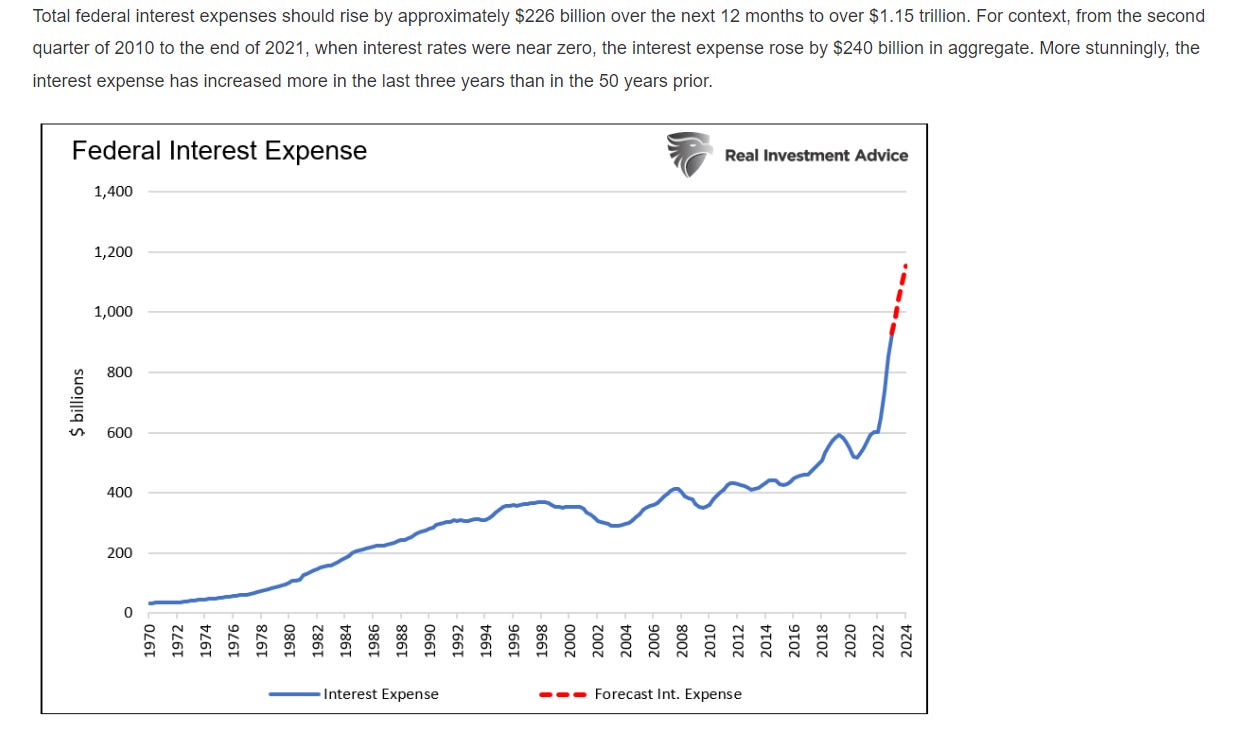
IMF also sounded the alarm bell on the growth slowdown in advanced economies, but emerging markets’ growth looks much more resilient (see article link below).
Next week, we will monitor US July non-farm payrolls and unemployment rate, the Bank of England rate decision, China July Caixin manufacturing PMI, and Apple and Amazon earnings to round out other strong results from Meta and Alphabet.

Economy and Investments (Links):
Global Economy on Track but Not Yet Out of the Woods (IMF Blog)
The Coming Collapse of China? (Matthews Asia)
Deeper into the Bank of Japan's Yield Curve Control Tweak (Seeking Alpha)
Finance/Wealth (Link):
Can You Afford to Retire (The Economist)
The Economist is running a special series on investing articles so you may want to take advantage of their free one-month trial to read these articles.
Wellness/Idea (Link):
The Sorry State of Search Is an Ominous Sign for the AI Era (Bloomberg)
+: Traditional Chinese Diets: A Template for Healthy Eating Habits (Harvard Medical School)
++: For Elon Musk, X equals everything (The Verge)
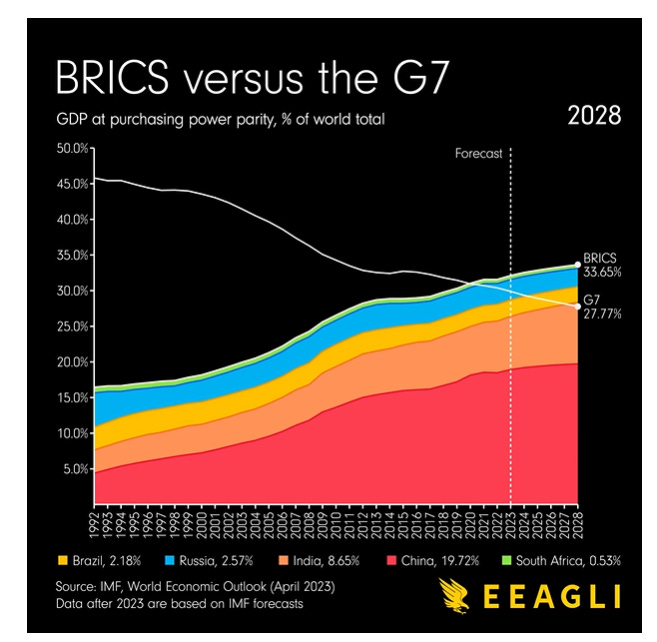
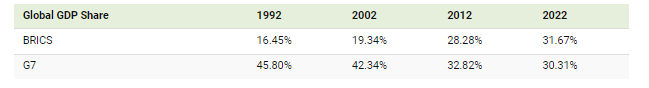
One Chart You Should Not Miss: The Rise of the BRICs vs. G7 GDP (based on Purchasing Power Parity PPP)
Using the PPP metric, which adjusts the GDP using international dollars (with the USD as the base currency) and better accounts for the cost of living and inflation, the BRICS (Brazil, Russia, India, China, and South Africa) will constitute more of the world economy in 2023 than the G7 due to the BRICS’ industrial rise.
Click on the title link to see the dramatic rise of the BRICS economies vs. the G7 over time.
One Term to Know: Cyclically Adjusted Price-Earnings ratio (CAPE or Shiller PE ratio)
The CAPE was created by Yale University professor Robert Shiller and measures a stock’s (or market’s) price relative to its 10-year average inflation-adjusted earnings. As of July 28, 2023, the ratio is 31.94 compared to a mean of 17.
CAPE is used to evaluate whether the stock or market is overvalued or undervalued. Its added advantage is that it smooths out earnings over a cycle of ten years. However, it is not very useful in predicting future returns because the ratio looks backward and heavily relies on GAAP (generally accepted accounting principles) earnings, which have undergone substantial changes over the years.


Please do not hesitate to get in touch if any questions! If you like this weekly, please share or subscribe to my newsletter.