


Weekly Good Reads: 5-1-1
"Reciprocal" Tariffs Derivations, Capital Markets Rout, How to Invest Now, How to Rest, Balance of Payments
Welcome to a new Weekly Good Reads 5-1-1 by Marianne, a 25-year investment practitioner sharing something interesting and topical in investing, the economy, wellness, and AI/productivity.
Thank you for supporting my work!
Sharing the quote of the week:
You miss 100 percent of the shots you don't take.
~ Wayne Gretzky
You will find some useful sections below.
Weekly archives | Investing | Ideas | Index of charts and terms
Conversations with Female Investors and more (to inspire more females into finance and investment careers 🙌).
👉 Interested in building customized and diversified investment portfolios tailored just for your goals and risk profile in 5 easy steps? Please try our firm’s solution R4A. It’s free!
Market and Data Comments

This week saw Trump’s “Liberation Day” reciprocal tariffs announcements (on more than $2.5 trillion of US imports) targeting every country on earth (including those that are inhabitable!) that push the US average tariff rate to around 22%, the highest level in 100 years—much worse than expected (more later).
The March non-farm payrolls added a seasonally adjusted 228,000 jobs, with average earnings growth of 0.3% m/m, and the unemployment rate ticking slightly up to 4.15%. The job report is a lagging indicator, mainly reflecting the weather-related jobs rebound.
The March ISM Manufacturing slipped to a contractionary territory at 49 (50.3 prior), with the new orders and employment indices plunging 3 points to 45.2 and 44.7, respectively. Tariff expectations and DOGE activities are already negatively impacting employment and new investment spending.
US stocks lost over $5 trillion in the last two days of the week, the worst amongst global stock markets, worse than the sell-off in March 2020 as COVID-19 hit.
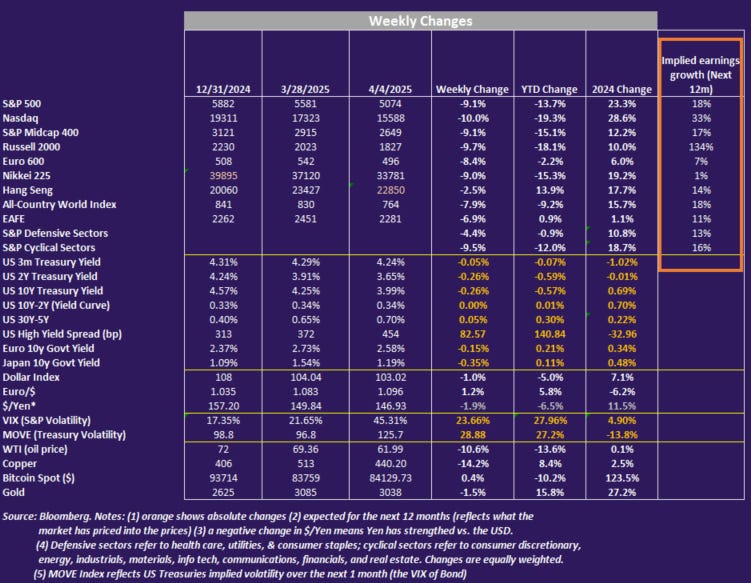
Nasdaq fell the most YTD (~ -19%) among developed countries’ stock indices (S&P 500 -13.7% is the second worst), while Europe was up +5.4%, Hang Seng, +13.8%, China A-shares, -1.6%, and Nikkei, -9.4%.
YTD, only the US consumer staples sector has a positive return. That is not the picture you would expect of “Making America Great Again”, unfortunately.

More alarmingly, the tariffs shock is negatively impacting companies’ investment plans, M&A, and fund-raising activities, including IPOs, spooking junk bond spread by a whopping 83bp to 454bp and the VIX by 24 points to 45.3% this week (see Weekly Change Table).
US regional banks and bank stocks fell 14% and 15.5%, respectively, in 2 days after the reciprocal tariff announcements, worse than the 10.5% sell-off in the S&P 500 index. Oil and copper tumbled by 10.6% and 14% due to fear of a global recession.
More fundamentally, tariffs do not increase the cost of a foreign nation but immediately exert a price increase (like a consumption tax) on your citizens. The first time Trump raised tariffs, companies had more or less absorbed the costs, but with every country being slapped on tariffs, trade redirection is less likely, and US consumers will likely get hit with the price increase.

As many have pointed out (see Econ/Invest #1 and Axios), Trump’s administration's calculation of reciprocal tariffs has nothing to do with tariffs, currency manipulation, and trade barriers as they claimed. The complicated formula (top chart, unpacked by Axios) calculates the “tariffs charged to the USA” as the greater of two different quantities: (a) 10 percent, and (b) the 2024 US trade deficit in goods with a given country, divided by the total quantity of US imports from that country (Tax Foundation). It is simply a way to eliminate the US trade deficit with each country.
Look at this example to calculate the “reciprocal tariffs” on China (WSJ):
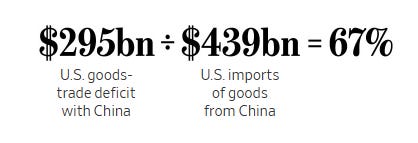
Tax Foundation further estimated that the tariffs announced before and on April 2 will raise close to $2.9 trillion in revenue over the next decade and reduce US real GDP by 0.7 percent, all before foreign retaliation. Trump’s tariffs will reduce after-tax income by an average of 1.9 percent, amounting to an average tax increase of more than $1,900 per US household in 2025.
In the two tables below, Bloomberg calculated the tariff shocks on major trading partners, the jump in average effective tariff rate, US economic growth and core PCE impact.
If the measures announced are all implemented, US GDP will be knocked down by 2.8%, while core PCE would jump by 1.6%. If the threatened tariffs on pharmaceuticals, semiconductors, timber, copper, and other USMCA-compliant goods are implemented, the total real GDP impact will be -3.9% and on core PCE will be +2.3%—a devastating economic outcome. These calculations have not considered retaliations from other countries (like China already declared a reciprocal tariff of 34% on all US imports.)


What is Trump aiming to do with these tariffs?
A good piece by
(Trump’s Tariff Gambit: Debt, Power, and the Art of Strategic Disruption) discussed that the strategy behind these tariffs is to “reset America’s economic foundations and geopolitical chessboard”. One immediate need is to help refinance the ballooning federal debt ($9.2 trillion refinancing in 2025 and $6.5 trillion by June) by pushing the US 10-year government bond yield down. Scott Bessent mentioned that every 1bp reduction in the yield saves $1 billion a year in interest payments. [But economists will tell you that to reduce government debt, you need fiscal and structural reform to create the right incentives to invest and to reduce spending.]How? With the fear of economic slowdown and a global recession, investors normally flee to US Treasuries as a haven, pushing down bond yields.

Trump’s bet is truly risky. Manufacturing capacity does not reshore in a switch. Reorganizing supply chains can take a decade, not to mention the expensive costs of US workers and the use of automation.
’s latest piece shows feedback from business owners on how they are coping (scrambling) with the tariffs.In the meantime, if inflation spirals out of control, the Fed is caught in a serious dilemma to cut rates to buffer the economic slowdown. Fed Chairman Powell said this past week, “Our obligation is to keep longer-term inflation expectations well anchored and to make certain that a one-time increase in the price level does not become an ongoing inflation problem…We are well positioned to wait for greater clarity before considering any adjustments to our policy stance.”
Based on his stance, the market, which prices in 4 interest rate cuts this year, seems ahead of itself. At the same time, JP Morgan’s chief economist already called for a US recession this year, revising his 2025 real GDP growth down to -0.3% and the unemployment rate up to 5.3%. Barclays also expected a recession with US real GDP at -0.1% Q4/Q4.
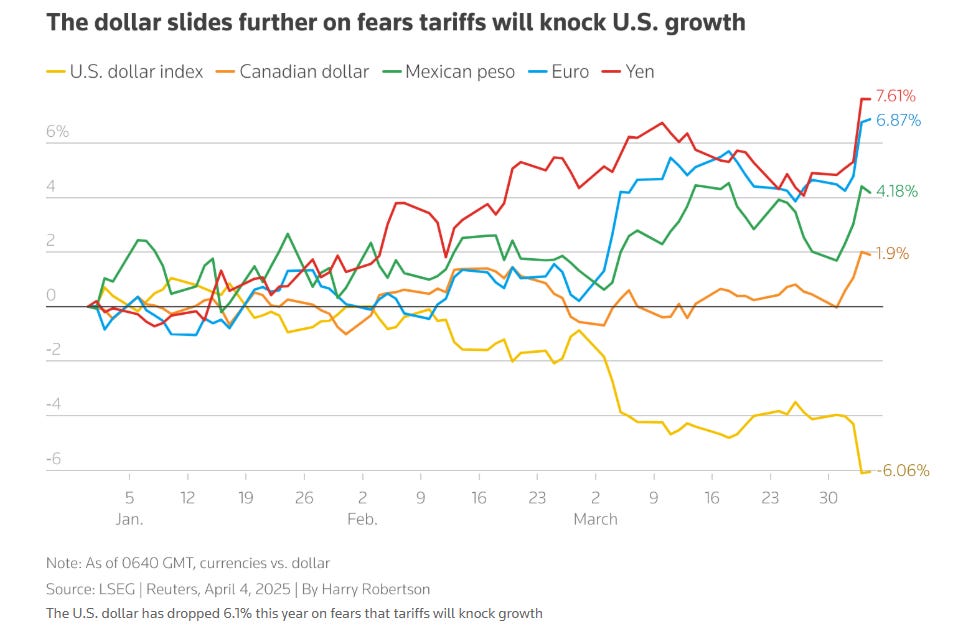
It is also important to watch the US dollar, which dropped almost 1.7% the day after the reciprocal tariff announcement. Normally, tariffs strengthen a country’s currency, but due to the macro uncertainty in the US, investors are sending capital outside of the US, and some are vowing not to invest in the US (e.g. France) (see Econ/Invest #2 and see One Term to Know: Balance of Payments.)
Dollar depreciation can undo the work of revenue raised from the tariffs and would cost US consumers even more in purchased goods. The Trump administration better ensure a dollar confidence crisis (already exacerbated by the rising federal debt) will not result.
For a great explanation of the tariffs, read
here and here.This coming week, we will monitor a series of Fed speak, March FOMC meeting minutes on Wednesday, March CPI on Thursday and PPI on Friday, Germany's February industrial production on Monday, March inflation on Friday, China’s total social financing, and March PPI and CPI on Thursday. We will also brace for more volatility from the capital markets and monitor subsequent tariff responses by other countries.


Economy and Investments (Links):
Trump’s Reciprocal Tariff Calculations Are Nonsense, Will Punish Mutually Beneficial Trade (Tax Foundation)
The method for calculating other countries’ so-called “tariffs” for reciprocal purposes is nonsense. Bilateral deficits are not tariffs, nor are they meaningful anyway; trade in services is relevant; and tariffs cannot be used to target overall trade deficits. The overall result is an extraordinary policy error that will severely damage the economy while failing to reduce the US trade deficit.
Next Up for Markets: A Crisis of Confidence in the Dollar (Reuters or via Archive)
The dollar, for decades a safe haven, on Thursday fell about 1.7% in its biggest daily drop since November 2022 (.DXY), opens new tab, after President Donald Trump imposed tariffs on imports at levels not seen since the early 1900s. Stock markets also tanked, as tariffs ignited recession worries…
Its [Trump administration] protectionist policies, upending of the global economic order in place since World War II, and a growing U.S. debt pile have been chipping away at the dollar's appeal, they say…Left unchecked, a crisis of confidence in the dollar could also undermine its position as the world's reserve currency, they added.
In Charts: Winners and Losers from Trump’s New Tariffs (FT or via Archive)
Asian countries got double hit little relief from exemptions)

Finance/Wealth (Link):
What to Do With Your Money Right Now as Tariffs Reshape Markets (Bloomberg or via Archive)
My take: This is not the time to panic, trade the news, or time the markets, but review your overall asset allocation that involves global diversification by asset classes, regions, and sectors, focusing on higher quality holdings—stocks and bonds. High yield and lower quality bonds will suffer in this slower growth/recessionary environment.
Wellness/Idea (Link):
50 Ways to Rest (Nicola Jane Hobbs)
(A necessary read during these times!)
One Chart You Should Not Miss: Labor Market Distributions Spider Chart (Atlanta Fed)

According to the Atlanta Fed:
The Labor Market Distributions Spider Chart is designed to allow monitoring of broad labor market developments by comparing current conditions to those in up to two earlier time periods that the user selects. Distributions of the labor market variables are constructed over a time period that the user also selects, with the inner and outer rings representing the minimum and maximum values of each of the variables.
The three dashed gray rings in the chart represent the 25th, 50th, and 75th percentiles of the distributions, respectively. Indicators of labor market status are broken up into five groups: Employer Behavior, Confidence/Perceptions, Utilization, Wages, and Flows.
Data in the chart are updated twice monthly: once for the monthly Bureau of Labor Statistics employment report, and again for the Job Openings and Labor Turnover Survey (JOLTS) update.
One Term to Know: Balance of Payments
Many people understand trade balance, the difference between how much a country exports (both goods and services) versus what it imports—what Trump is trying to correct—as the US trade deficit has ballooned to almost $1 trillion at the end of 2024.

Trade deficit is not necessarily bad, as it is a result of the development of an economy (from manufacturing to services like the US), comparative advantages among different countries, wages differential, etc. and can reflect strong domestic investment opportunities and economic growth.
From the chart below, the EU, for example, ran a $200bn goods surplus with the US, which means the US net imports $200 billion of goods from the EU. The US, on the other hand, excels at exporting services—banking, insurance, consulting and legal advice.

Trade balance (or Balance of Trade) is a part of the Balance of Payments (BOP), which includes all international monetary transactions of a country within a period. When money comes in, it is a credit (asset); when money moves out, it becomes a debit (liability).
As you can imagine, BOP should theoretically net to zero, where asset = liability. In reality, it is not always the case due to measurement errors or often “capital flight”.
BOP has three components:
Current account balance = Trade Balance + Net Dividends + Net Remittances
Capital account balance = Capital Transfer (e.g. grant/aid) + Non-produced, Non Financial Assets Transactions (e.g. intangible assets).
Financial account balance = Net Direct Investment (long-term) + Net Portfolio Investment (stocks and bonds) + Other Investments
Current Account Balance = Capital Account + Financial Account Balance.
The Financial account is usually much larger than the capital account balance.
Note that a large trade deficit (and therefore a large current account deficit) is not always problematic as it means foreigners see attractive investment opportunities in the US, reflecting its economic growth and opportunities, which further stimulates domestic investment and growth.
From the chart below, the US current account deficit has been more than covered by financial (portfolio) inflows (driven mainly by foreigners buying US Treasuries).

In the case of the current Trump tariffs shock to the global economies, if foreigners perceive the US as an uncertain economy/investment destination, US long-term debt securities will become less attractive, with adverse implications on the financing of the current account deficit as well as problems for the dollar.
[Good reads:
’s Primer I and II on Balance of Payments.][🌻] Things I learned About AI/Productivity:
Using GPT-4o To Make Stunning, Original Illustrations in ANY Style (AI In Real Life)
According to the author, with the latest GPT-4o image generator, you can not only transform a photo image into a beautiful original illustration in any visual style but also call up a particular visual style (e.g. art deco), ask GPT-4o to analyze it, feed your own photo, and ask it to transform your image into that particular visual style—your original creation (YouTube illustration).

Art Deco Style of Myself by ChatGPT 4-0 (it even copied my sweater pattern exactly) Is Deep Research Worth $200 a Month? (Section)
Deep Research is a good investment for your business if:
*Your use cases leverage Deep Research’s strengths (publicly available data) and tolerate its limitations (no access to company data, needs human review)
*You have the bandwidth to manage a new agentic teammate
*$200/month is less than you’re paying for current research capabilities, either on your own team or via a contractor – OR you can accelerate output significantly with this new capability.

Please do not hesitate to get in touch if you have any questions!
Please also check out my Conversations with female fund managers, wealth advisors, and more.
If you like this Weekly, please share it with your friends or subscribe to my newsletter🤝.
Business confidence is heavily hit and planning becomes very difficult when CFOs doesn't know where tariffs and economic conditions will end up at a year from now. I've seen this movie before in other countries when investment spending evaporated on policy uncertainties. I worry the damage to balance sheets when interest rate comes down slower than the speed at which margin and free cash flow declines. Hope I am wrong!