


Weekly Good Reads: 5-1-1
Global Rally, Japan, ETFs vs Mutual Funds, Magnificent 7 (graphics), Labour Market, Rewire our brain
Welcome to Weekly Good Reads 5-1-1 by Marianne O, an investment practitioner and author of
about investing, economy and wellness ideas. Every week I include 5 links to relevant economic and investment, finance and wellness/idea pursuit as well as 1 important chart and 1 term to know. All the Weeklies are here and here is the index of charts and terms. You can easily subscribe to my newsletter by clicking below.Thank you for reading this Weekly and supporting my work 🙏.
Market and Data Comments
The US Fed’s pivot towards rate cutting next year after the FOMC meeting on Wednesday has ignited a global rally in bonds and stocks.
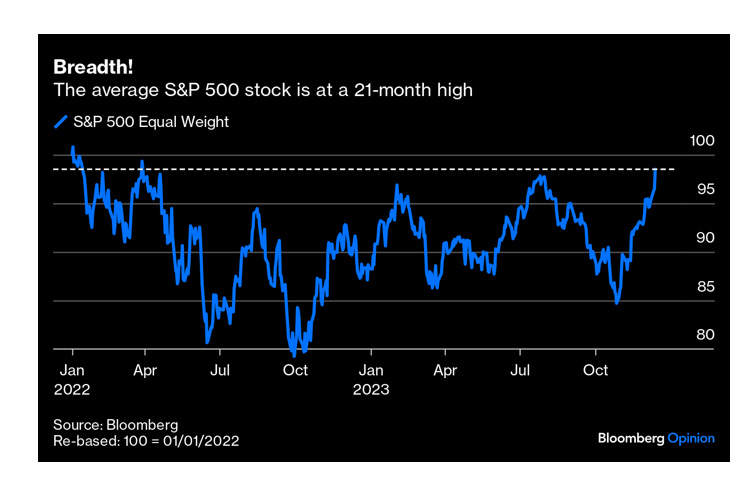
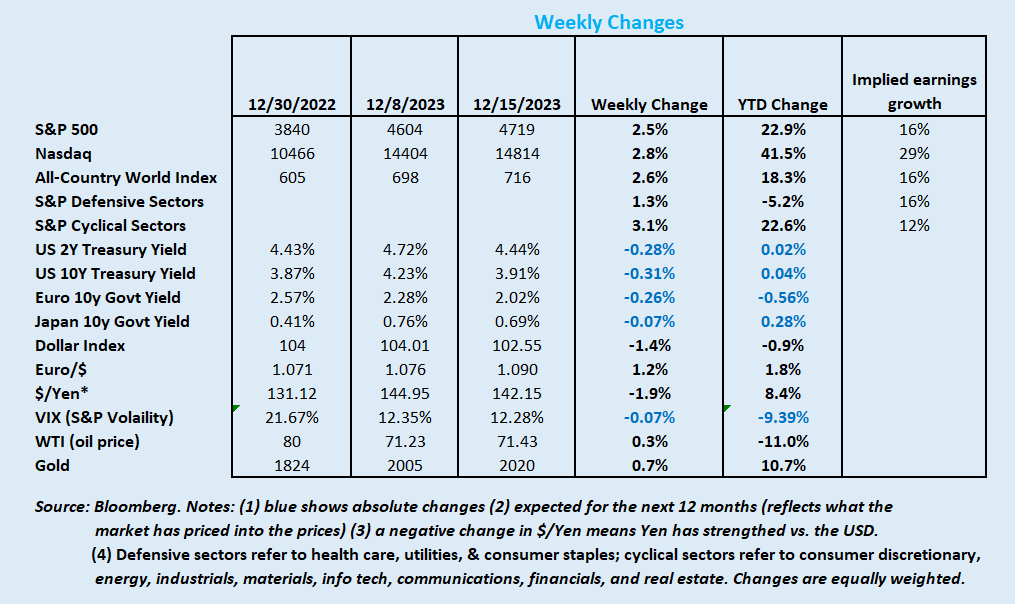
From the table below, global stocks rose 2.6 to 2.8% while the US 2y and 10y government bonds rallied around 30bp this week. The chart above shows the widening breadth of the rally (no longer concentrated in a few names), with the equal-weighted S&P 500 jumping 15% since the recent trough in late October.
The casualty is in the US Dollar Index, which declined 1.4% this week, sending it to a negative territory YTD as the market is quick to price in 140bp of rate cuts next year.
What did the latest December Fed’s Summary of Economic Projections (SEP) reveal to cause this rally? Please see my interpretation of the Fed Dot Plot and the economic projections in detail below:

The bottom line: the Fed is acknowledging the faster-than-expected disinflation and soft-landing of the US economy, so they are looking next to rate-cutting. It is crucial to note the Fed is targeting real interest rates (nominal interest rate minus inflation), not nominal interest rates. So when they are signalling rate cuts of 75bp next year and 100bp in 2025, this is in line with their projections of falling inflation to ensure monetary policy is not overly restrictive to tip the economy over; so, rate-cutting when inflation is falling is not equivalent to easing monetary policy. Moreover, quantitative tightening via the run-off of $95 billion of Treasuries and Mortgages continues.
Meanwhile, the European Central Bank and the Bank of England sounded more steadfast in not cutting rates anytime soon. Nonetheless, growth in Europe is weaker than expected as seen in the contractionary PMIs, coupled with falling inflation, rate-cutting is inevitable in 2024.

In Japan, the market expects the Bank of Japan to move away from negative rates next year as CPI has elevated to 3.8% yoy with the labour market getting tighter.
In China, November CPI dropped -0.5% yoy while PPI was worse at -3% yoy. With deleveraging from the housing sector, China’s reflation policy has not been potent enough. Watch the big NPC meeting in March on more fiscal easing to help them achieve the expected 5% GDP target for 2024.
This coming week, we will monitor the Bank of Japan monetary policy meeting and the European November inflation rate on Tuesday, the U.K. CPI on Wednesday, the U.S. final Q3 real GDP and Japan’s November CPI on Thursday as well as US November personal spending.
Economy and Investments (Links):
Jay Powell’s Festive Giveaway to Investors (FT or click here)
COP28 Ends with Legacy Potential after Breakthrough Fossil Fuel Pact (Axios)
Emerging Japan (Matthews Asia)
The industrial and technological capabilities of Japanese companies, as well as their operational efficiencies, is placing them in expanding areas of manufacturing, from renewable energy to information technology (IT) and artificial intelligence (AI). Japanese health-care companies are in many cases pioneers and market leaders in their fields from their service to an aging domestic population and they are now increasingly building their overseas business in markets that have similar needs. And while concerns grow over a potential global slowdown, we think recovering demand in China will offer an additional, meaningful channel of growth for Japan corporates over the long term.~Shuntaro Takeuchi (portfolio manager) at Matthews Asia
Many professional investors have already fallen back in love with Japan due to the government’s interest and focus on improving the corporate governance of Japanese companies and implementing capital efficiency reforms, thereby increasing return on equity (increased buybacks, dividends, etc.)
Finance/Wealth (Link):
ATM: Mutual Funds vs. ETFs (Big Picture, a conversation with David Nadig at Vetta Fi/ETF Trends)
One key advantage of ETFs over Mutual Funds is the tax efficiency of ETFs. Even if you don’t sell your mutual fund during the year, you get taxed on capital gain distribution because your mutual fund managers trade throughout the year for some other clients and pass through all those gains/losses to the pool, so you get taxed. You pay a capital gains tax only when you sell an ETF higher than the price you pay for it - simple.
Without selling a darn thing so anybody who’s owned a mutual fund in a taxable account knows this you get a distribution you didn’t sell anything some of that’s dividend from stocks or coupons from bonds but some of it’s just “Hey we bought and sold some stuff, we have to pass that out every year” that’s the rule the IRS has and by passing that out you mess with every holder of that fund’s taxes for that year. And they take away a timing benefit because you have to recognize that this year even though somebody else sold.~David Nadig, The Big Picture
Wellness/Idea (Link):
How I Rewired my Brain in Six Weeks (BBC)
This is one of Pocket’s most saved articles of 2023, and the article references this free online course for Mindfulness, which seems a perfect place for me to start.
One Chart You Should Not Miss: The Magnificent 7 vs. the Rest of S&P 500 Stocks
You have probably heard the Magnificent 7 stocks (Apple, Nvidia, Tesla, Amazon, Alphabet, Meta, and Microsoft), which make up 27% of the S&P 500 Index, contributed a majority (~2/3) of this year’s S&P 500 22.6% return.
The Magnificent 7 and AI are the stock themes of 2023.
The question is what has contributed to the total return performance of these stocks, and are they still worth buying? Indeed, the stocks played catch-up from the big losses in 2022. Still, a look at the fundamentals will tell you the companies as a group have better next 1-year revenue growth (1.45x vs. the rest of the 493 stocks), much better next 1-year EPS growth (2.5x), outstanding net margin (4x), better free cash flow margin (1.7x), and much lower leverage measured by net debt/EBITDA (-0.31 vs. 1.93x).
We like to look at the economic value-added (EVA) spread proxied by ROE (forward) minus the implied cost of equity, i.e. whether the company is creating shareholder value. From the chart below, we estimated the EVA spread of the Magnificent 7 is about 47% while the rest of the 493 stocks are about 10% (4.7x). Given this large buffer of EVA spread, their stocks should continue to perform well.
The common investment themes of these companies are large installed and customer base, high and improving margin, improving return on equity, rising contribution from the cloud or data-centre businesses, cost optimization, scale, opex discipline, and very low leverage. As a result, they often belong to the “quality” basket of stocks, which will continue to be a theme the market focuses on as the economy slows.
Feel free to click on the graphics below and filter by names or measures.

One Term To Know: Unemployment Rate vs. Labour Force Participation Rate
The U.S. Bureau of Labour Statistics reports key unemployment indicators which include the unemployment rate and the labour force participation rate.
The basic concept of measuring employment in the US dates back to 1940: people with jobs are employed, and people who do not have jobs and are looking for jobs (in the past 4 weeks) are unemployed. People who do not meet either labour market test are not in the labour force, which comprises the employed and the unemployed.
The unemployment rate is the number of unemployed people as a percentage of the labour force (employed + unemployed).
The Labour Force Participation Rate (LPS) is the number of people in the labour force as a percentage of the civilian non-institutional population 16 years old and above. The denominator does not include institutionalized people (those in prisons, nursing homes, or mental health facilities) and members of the military.
The LPS measures the percentage of the population that is either working or actively seeking employment. This is a better measure than the unemployment rate because the base/denominator of the Labour Force Participation Rate takes into account those who have given up looking up for work (the “discouraged worker”) while the unemployment rate does not take those discouraged workers into account.
What affects the LPS? More retirees, more women entering the workforce, and COVID-19 keeping workers at home are all factors that affect LPS.
Quick facts: total LPS: 62.8%, women’s: 57.5%, men’s: 68.4% as of November 2023.

Please do not hesitate to get in touch if you have any questions! If you like this weekly, please share it with your friends or subscribe to my newsletter.
You should also include Bitcoin price to follow in your weekly changes.
great coverage, thank you!