


Weekly Good Reads: 5-1-1
On U.S. bull market, contrasting market signals, Asian deflation, and "awe walks"
Welcome to another issue of 5-1-1! I am Marianne O, an investment professional and author of The Learner’s Mind on investing, economy, and wellness ideas. For this Weekly, I include 5 links to relevant economic and investment news, finance, and wellness/idea pursuit based on what I read. I also include 1 important chart and 1 investment term to know. You can easily subscribe to my newsletter by clicking below.
Market and Data Comments
It is hard to miss the headline news the S&P 500 Index entered a bull market this Thursday when stocks rallied 20% from their October 2022 low on the back of optimism that the Fed will soon stop hiking rates.
Policymakers in Australia and Canada hiked interest rates each by 25bp this past week when the consensus thought they would pause. This may suggest what may come in US interest rate decisions. According to Barclays:
…continued strength in service-oriented private consumption supported by robust labour markets and recent rebounds in house prices. This, in turn, adds to core inflation persistence, threatens a deterioration in inflation expectations and, thus, puts in doubt an eventual return to the 2% target. Hence, central banks would prefer to add hikes now, accepting the short-term risk of overtightening and recessions, to safeguard the long-term achievement of stable inflation around the 2% target.
One source of global inflation is missing: China. Its May inflation rate was close to zero. Factory manufacturing contracted worse than expected in April while services expanded. Chinese exports shrank for the first time in three months, and the housing market remained a drag. As economist Andrew Hunt explained, while China is running a $1 trillion annual trade surplus, the surplus dollar has been used to repay its foreign exchange liabilities rather than being lent out or invested, further contributing to deflation within Asia.
Turning back to the perennial debate on U.S. recession or not, the signals coming from asset prices are conflicting (see One Chart below). While the S&P 500 Index, led by AI and tech stock rally, has entered a bull market, the yield curve (10-year minus 3-month Treasury rates) has continued to invert, reflecting the market expectation of a rate cut. Wall Street economists are climbing a wall of worry with JP Morgan modelling a likely 20% of equity market drop if bonds are proven correct in pricing inflation volatility.
To know how to frame the discussion of the U.S. recession and how to position investments, listen to The Informationist podcast below.
Given the contrasting signals from different markets and the various economic problems big central banks are grappling with, consider a barbell approach in investing - own growth stocks that benefit from long-term structural themes such as tech and AI and invest defensively by being in the healthcare and utilities sectors as well as short-term cash to capture yield.
Next week’s important events to watch include the FOMC meeting on June 13-14 and European and Japanese monetary policy decisions.
Economy and Investments:
Pod: Is the US Headed For a Recession? (@The Informationist)

Treasury’s $1 Trillion Debt Deluge Threatens Market Calm (WSJ)
Humans are biased. Generative AI is Even Worse (Bloomberg or click here) - Bloomberg analyzed 5000 images created with Stable Diffusion, which generates images using AI in response to written prompts, and found that generative AI can take disparity to the extreme.
The world according to Stable Diffusion is run by White male CEOs. Women are rarely doctors, lawyers or judges. Men with dark skin commit crimes, while women with dark skin flip burgers.
Finance/Wealth:
Expectations Debt (Morgan Housel @Collab Fund)
Wellness/Idea:
This Kind of Walk Is Much More Than a Workout - Incorporating awe into your daily stroll can bring mental and physical benefits (NYT or here.)
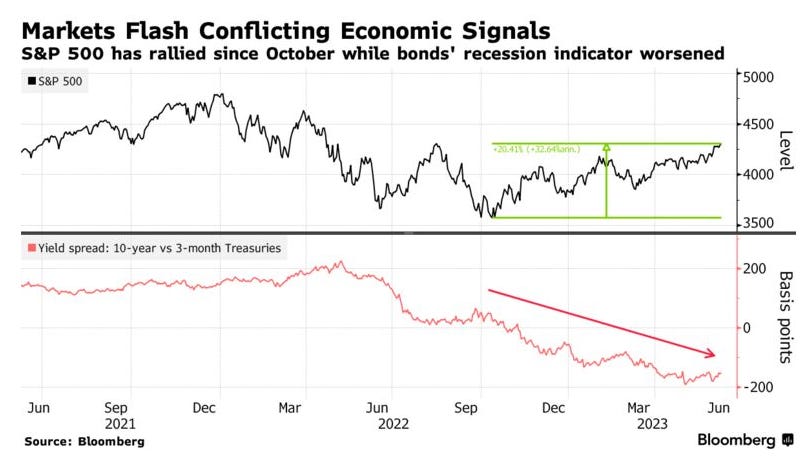
One Chart You Should Not Miss: Stocks and bonds showing contrasting signal for the U.S. Economy
While the U.S. S&P 500 has risen over 20% since last October, the yield curve, as measured by the difference between the U.S. 10-year government bond and the 3-month T-bill yield, has resumed its fall (i.e., the yield curve continues to invert) since September 2022. Yield curve inversion has preceded all previous eight recessions. Currently, economists have different takes on the yield curve inversion - Goldman Sachs believes the market is expecting a low-interest rate and low-growth economy will return (hence the lower long-term rates relative to short-term rates) while JP Morgan thinks the market is pricing in a rapid drop in inflation which means the Fed will soon cut rates.
One Term to Know: Economics data collection
Annual estimates of a country’s gross domestic product, the total value of all goods and services produced within an economy each year, started in the 1930s, thanks to the travails of the Depression. The first U.S. GDP estimate was delivered by Simon Kuznets to the U.S. Congress in 1934.
Output can be measured in three ways: by summing up (1) all the money spent each year, (2) all the money earned each year, or (3) all the value added each year. They are theoretically equivalent.
Economic data collection traditionally uses surveys or administrative records.
Data are gathered from many small surveys. America’s Bureau of Economic Analysis draws data from surveys of manufacturers, builders and retailers, as well as from trade and financial flows, among other sources. These data are used to estimate the components of GDP, such as total investment and net exports.
Currently, the collection of data is increasingly supplemented by more innovative methods:
Big data and machine learning
Web scraping and text analysis
Blockchain and digital currencies
Remote sensing and geospatial analysis
Citizen science and crowdsourcing
Please do not hesitate to get in touch if any questions! If you like this weekly, please share or subscribe to my newsletter.
Thank you Marianne ✌🏻